Pulse thermography

Principle

Principle pulse thermography
© Fraunhofer WKI
Principle of pulse thermography. Locally different heat distributions indicate invisible defects.

In pulse thermography, the material remains stationary and the surface of the object is briefly (a few milli- to microseconds) heated very homogeneously by a few degrees (less than 5 °C) using fast-acting radiators or flash lamps.

If there are no material differences or structural weaknesses beneath the surface, this heat pulse penetrates the material uniformly and the surface subsequently cools very homogeneously. If there are adhesion flaws, insect larvae feeding holes or other inhomogeneities below the surface where the heat flow to depth is impeded, this area on the surface is usually characterized by a higher temperature, and in rare cases by a lower temperature. These locally differently warm areas of the surface can be detected with the help of a thermographic camera.

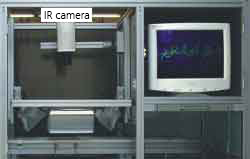
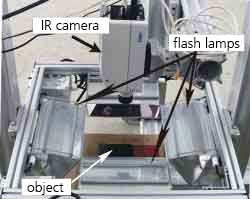
The setup shown in the following pictures is available at the Wilhelm-Klauditz-Institut (WKI) for investigations using pulse thermography. In it, small series of samples with the size of approx. 0.5 x 0.5 m² can be automatically examined and evaluated.

Implus thermography arrangement
© Fraunhofer WKI
Arrangement of IR camera and 4 flash lamps for the examination of objects with impulse thermography.
Pulse thermography setup
© Fraunhofer WKI
Impulse thermography set-up at the Fraunhofer Institute for Wood Research WKI for the examination of small series of materials for signs of detachment such as corrosion etc.

Application example: Liability error using the example of a veneer of indeterminate depth

Thermographic image of adhesion defect in false color display
© Fraunhofer WKI
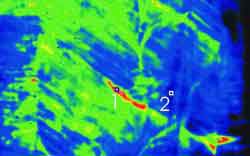
Thermographic image of adhesion defects in false color display, approx. 20 s after heat application.

Since it is often not known at what depth a defect is located, and the thermal conductivity of materials varies greatly, entire series of successive images must be recorded so that as many defects as possible can be found. This is demonstrated on a historical marquetry piece that has veneer adhesion defects at a certain depth. The heating of the sample with a size of 50 x 50 cm2 takes place with the IR radiator within a few milliseconds and results in a temperature increase of the surface of approx. 1°C.

Time course of the surface temperatures
© Fraunhofer WKI
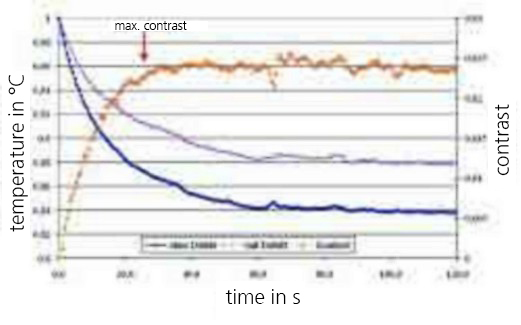
Time course of surface temperatures and contrast on (no. 1) and next to a defect (no. 2).

The cooling behavior of the surface over the intact and the defective adhesive joint can be clearly seen from the different cooling curves. From these curves, the optimum exposure time for detecting the adhesion defects is given by the best thermal contrast, which occurs after approx. 25 s. The poor adhesion of the veneer layer can be recognized by the warm areas, as good adhesion is characterized by very uniform thermographic images.

Application example: Rust infiltration on painted metal surfaces

Thermogram metal plates
© Fraunhofer WKI
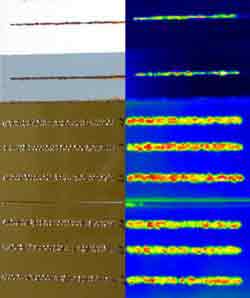
Three metal plates with different coatings (right) and a corresponding thermogram (right) 40 ms after penetration of the heat pulse.

Usually, rust infiltration on painted metal surfaces is determined by laboriously and time-consumingly lifting off the infiltrated layers of paint.

With the aid of thermography, rust infiltration can be observed non-destructively down to the finest ramifications. Since the material is not destroyed during this examination, it is possible to continue the stressful climatization and thus observe the progression of corrosion on the same material.

Application example: Coating thickness determination of coatings

Coating thickness determination on paint
© Fraunhofer WKI
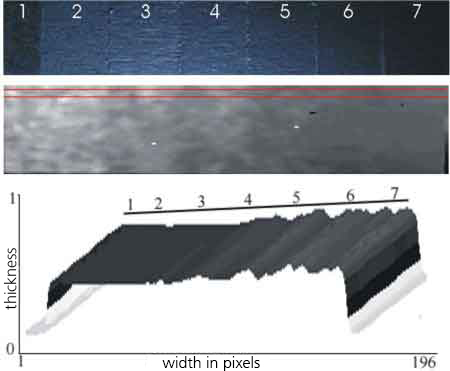
Determination of coating thickness on paint. Photo of 7 paint layers (top), thermography image (middle) and height profile (bottom).

In addition to detecting adhesion defects close to the surface, it is also possible to determine the layer thickness of paints and coatings if the physical properties of this material (thermal conductivity, density, heat capacity) differ from those of the underlying carrier substrate.

The image shows a qualitative coating thickness determination, in which the increasing coating thicknesses can be seen from left to right. Below this, the thermographic image is shown shortly after exposure to the heat pulse.